
Table of contents
Quick Answer — Order flow trading strategy — how it works
- • Order flow trading reads real executed orders, not price patterns: the DOM (depth of market), footprint or cluster charts, time and sales (the tape), and cumulative volume delta (CVD)
- • The four core setups are absorption (large limit orders soaking up market orders), exhaustion (aggressive flow drying up at an extreme), imbalance (one side far outpacing the other, especially stacked imbalances), and liquidity sweeps (price grabbing resting stops then reversing)
- • Footprint charts show buy versus sell volume inside each candle; the DOM shows resting liquidity; the tape shows the speed and size of executions; CVD tracks net aggression over time
- • Common platforms are Bookmap (heatmap of resting liquidity), plus footprint tools like Sierra Chart, ATAS, Volumetrica, Quantower and Tradovate add-ons
- • Order flow works best on centralized futures markets (ES, NQ, GC) where volume is real and consolidated, which is why it fits most US futures prop accounts
An order flow trading strategy bases your entries and exits on the actual buy and sell orders hitting the market, instead of on lagging indicators built from closed prices. You read the order book, the footprint of executed volume, the tape and cumulative volume delta, then act on what aggressive and passive traders are doing right now, not what a candle did five minutes ago.
I trade futures, mostly ES and NQ, and order flow is the layer that changed how I time entries. A moving average crossover tells you the trend already turned. The tape tells you the moment a large buyer stops defending a level. That timing gap is where most of the edge lives.
This is a how-to, not a sales pitch. By the end you should know the four core data views, the four classic setups, the tools that show them, and why order flow fits futures and most prop accounts better than it fits stocks or anything synthetic.
What order flow trading actually reads
Order flow trading reads four data streams that sit underneath the price chart. Each answers a different question.
- The DOM (depth of market): the ladder of resting limit orders above and below the current price. It shows where liquidity sits, the orders that have not traded yet.
- Time and sales (the tape): every execution as it prints, with size and which side was the aggressor. It shows how fast and how big the flow is.
- Footprint or cluster charts: each candle split into buy volume versus sell volume at every price inside it. It shows who won at each level.
- Cumulative volume delta (CVD): a running total of aggressive buying minus aggressive selling. It shows the net balance of aggression over time.
Price is the output of all four. Order flow trading is reading the inputs before the output prints. For the wider toolkit around this, the order flow trading guide walks through each data view in more depth, and how to read the order book covers the DOM on its own.
Aggressive versus passive orders
Every trade has two sides: someone passive resting a limit order, and someone aggressive crossing the spread to take it. Market buy orders lift the offer (aggressive buying). Market sells hit the bid (aggressive selling). The whole language of order flow is built on this split. Absorption is passive winning. Exhaustion is aggressive running out. Imbalance is one aggressor dominating.
Why closed-candle indicators lag
A 14-period RSI, a MACD, a moving average: all of them are math on prices that already happened. They are useful for context and I still glance at them. But they cannot show you a 200-lot bid refilling on the DOM or a wall of stops getting swept, because those events live below the candle. Order flow trading is the view of the events themselves.
The four core order flow setups
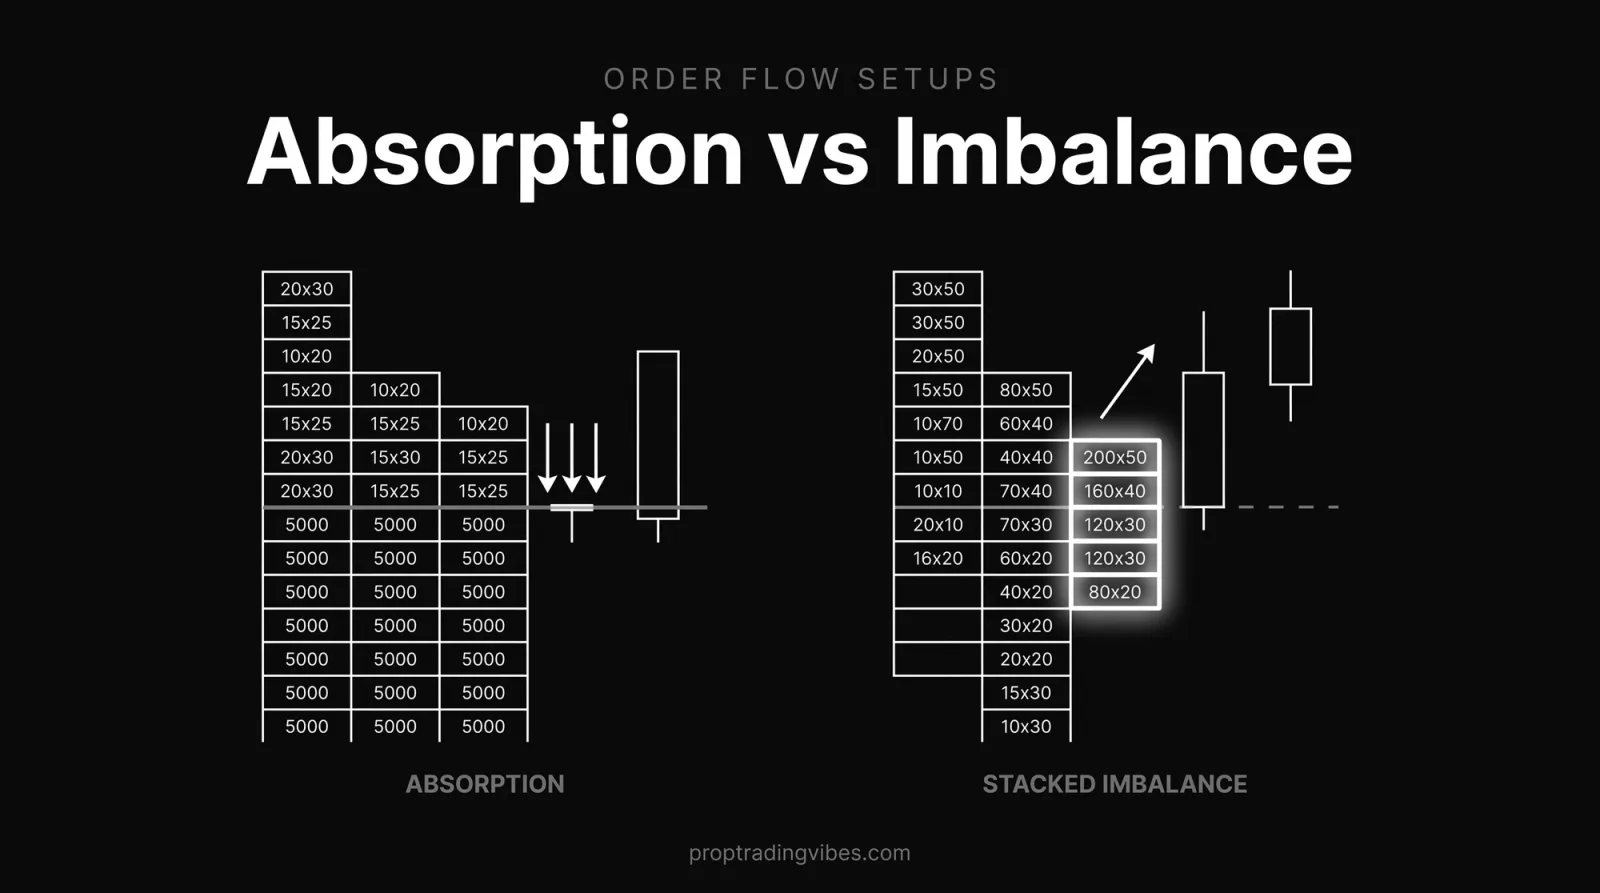
Order flow trading reduces to four repeating patterns: absorption, exhaustion, imbalance and liquidity sweeps. Learn their signatures on the footprint and the DOM and you have the core of every strategy in this style.
Absorption: when aggression hits a wall
Absorption is when aggressive market orders hammer a price level but price does not move, because a large resting limit order is soaking all of it up. On the footprint you see heavy sell volume at a level with no downward follow-through. On the DOM you see a big bid that keeps refilling instead of pulling. The aggressive side is spending ammunition; the passive side is holding.
Absorption is one of the highest-quality reversal tells in order flow trading, because it shows a real participant defending a price with size, not a pattern you drew on a chart. The trade is to fade the exhausted aggressor once price confirms it cannot break the absorbing level.
Exhaustion: when the fuel runs out
Exhaustion is the trend-side version of the same idea. Price reaches an extreme, but the footprint volume on the trending side shrinks and CVD stalls. The last push had no fuel behind it. Where absorption shows the passive side winning, exhaustion shows the aggressive side simply giving up. The two often appear together at a turn: the trend exhausts while a big passive order absorbs the final orders.
Imbalance and stacked imbalances
An imbalance is when buy volume heavily outweighs sell volume, or the reverse, at a price on the footprint, usually flagged at a diagonal ratio like 3:1 or 4:1 between bid and ask volume. One imbalance is noise. Stacked imbalances, several in a row in the same direction, are the signal: one side is aggressively running the other over. Most footprint platforms highlight them for you. Traders use a stack of imbalances as a continuation or breakout confirmation, not a reversal.
Liquidity sweeps: the engineered stop run
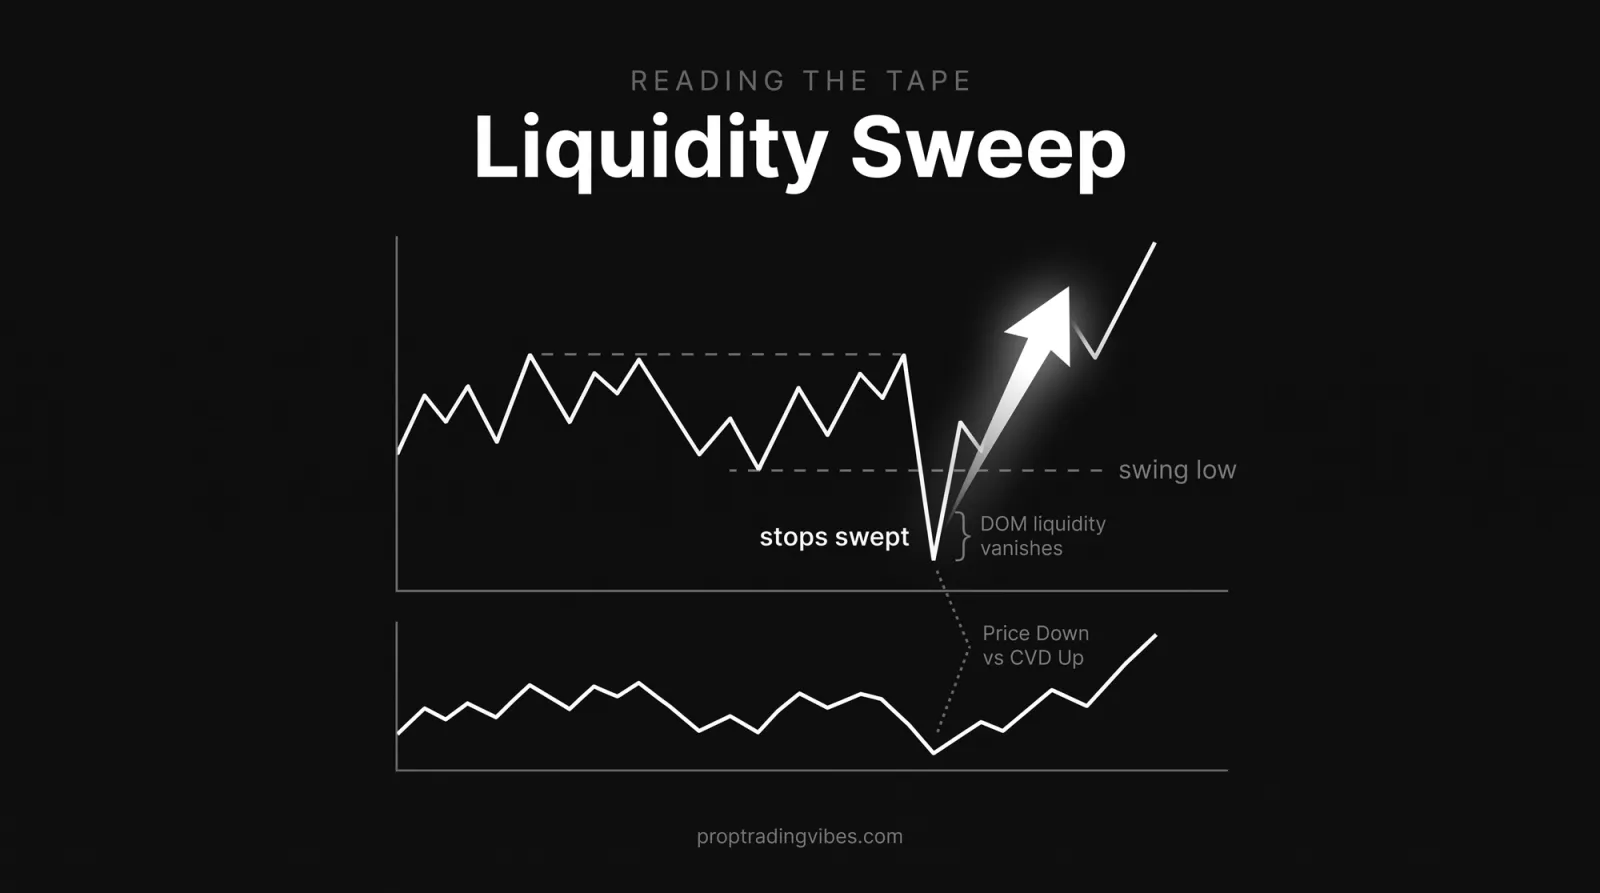
A liquidity sweep is when price pushes through an obvious level where stops are resting, just below a swing low, say, triggers those stops, then reverses hard. The move exists to fill large orders against trapped traders. In order flow you read it as a sequence: the tape accelerates into the level, DOM liquidity vanishes, then aggressive flow flips to the other side immediately. The reversal after a clean sweep is one of the more reliable order flow entries because you can see the trap spring in real time.
How I trade order flow on futures
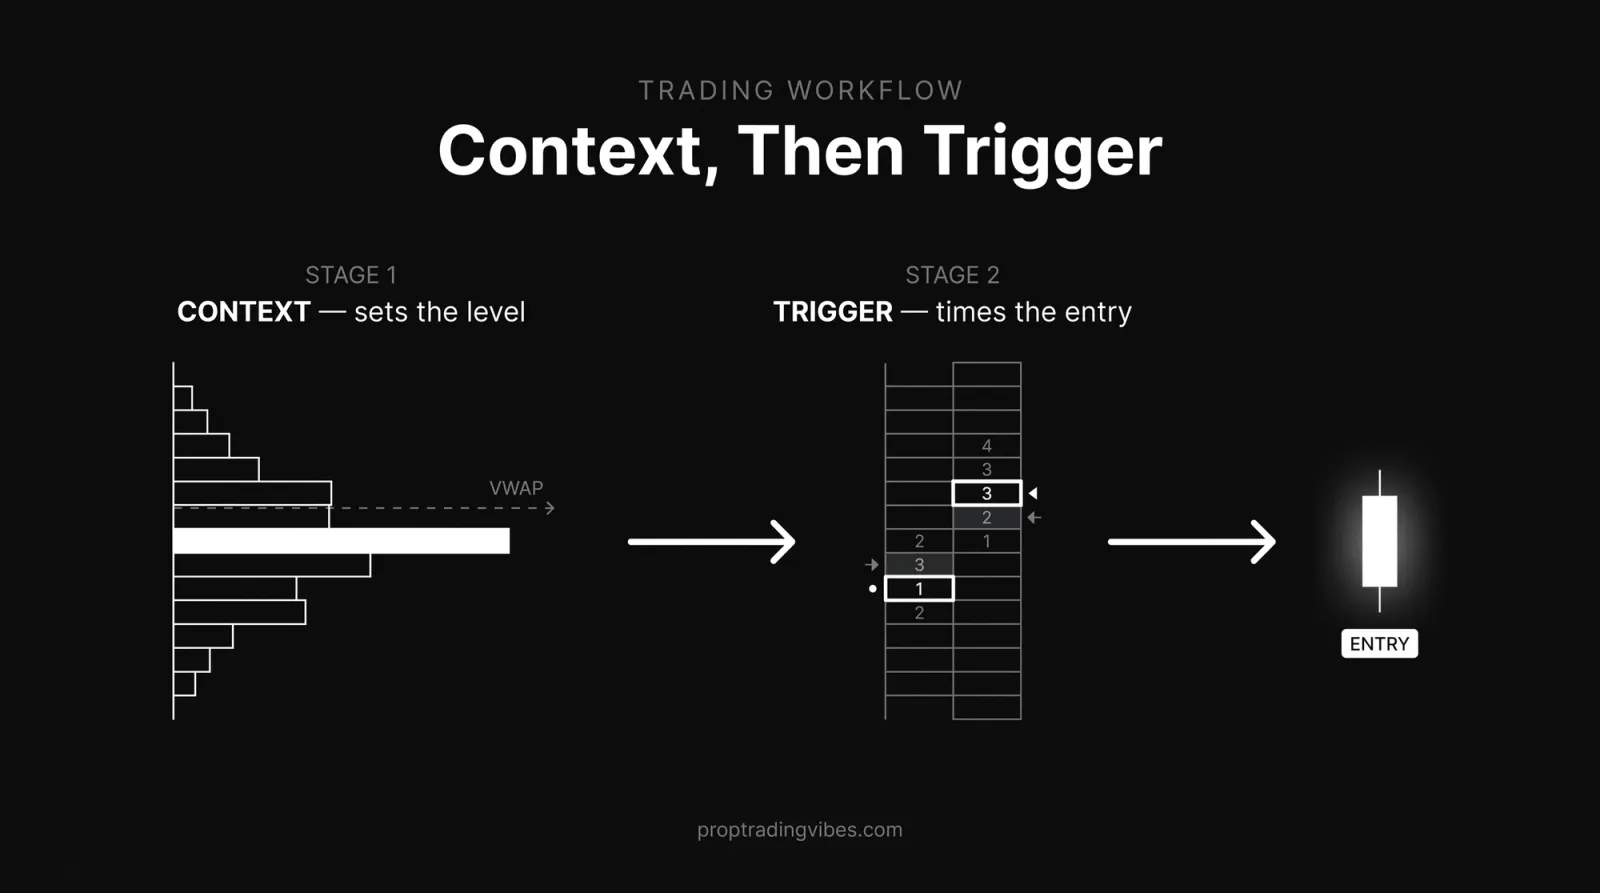
I trade these setups on ES and NQ, and the workflow is always context first, trigger second. The mistake new order flow traders make is staring at the tape with no map. The tape is the trigger, not the plan.
Build context, then time with flow
I set my levels with longer-timeframe tools, then drop to order flow only at those levels. My context layer is volume profile and VWAP. A high-volume node from the profile or a VWAP band gives me a place where a reaction is likely; the footprint and tape give me the entry once price gets there. How to use volume profile and the VWAP trading strategy cover that context layer, and market profile trading goes deeper on the acceptance and value-area logic behind the levels.
The pairing matters: volume profile is the where, order flow is the when. I do not take an absorption trade in the middle of nowhere. I take it at a level the profile already told me to watch.
My checklist before an order flow entry
- Price is at a pre-marked level (volume profile node, VWAP band, or session high/low).
- The footprint shows a clear signature: absorption, exhaustion, or a stacked imbalance.
- The DOM and tape agree, big resting order holding, aggression fading or flipping.
- CVD confirms or at least does not contradict (divergence at a high is a plus for a fade).
- My risk is defined before the entry, not after.
If three or more line up, I take it. If the footprint says one thing and CVD says the opposite, I pass. Conflicting flow is a no-trade, and learning to sit out is half of trading order flow well.
Order flow is an execution edge, not a system
I want to be blunt about this. Across 5+ years and 30+ payout cycles at Lucid Trading and other firms, order flow has never been a standalone system for me. It is the precision layer on top of a structural read. The structure tells me what to trade; the order flow tells me exactly when to hit it and when to bail. Traders who treat the tape as a complete strategy tend to overtrade, because the tape always shows something. The discipline is only acting at your levels.
The tools and data you need
Order flow trading needs real depth data and a platform that visualizes it. The data feed matters more than the front end.
Level 2 depth and the tape are non-negotiable
You need Level 2 market depth, the DOM showing resting bids and offers beyond the best price, plus tick-by-tick time and sales. Level 1 (top-of-book bid, ask and last) cannot show absorption or a sweep. Futures exchanges sell this depth, which is the practical reason order flow lives on futures: the data is available, consolidated and real.
Platforms that show order flow
| Tool | What it is best at | Notes |
|---|---|---|
| Bookmap | Heatmap of resting liquidity over time, speed of tape | The reference tool for visualizing the DOM as a heatmap |
| Sierra Chart | Deep footprint and numbers-bars charting | Heavy, highly configurable, popular with serious tape readers |
| ATAS | Footprint, cluster and CVD analytics | Strong out-of-the-box order flow visuals |
| Volumetrica | Footprint and volume analytics | Used in several prop platform stacks |
| Quantower | Footprint, DOM, multi-broker | Common in prop firm platform line-ups |
| Tradovate | DOM plus order flow add-ons | Default at many futures prop firms |
Bookmap review goes deep on the heatmap workflow specifically, and the FundedSeat Volumetrica setup shows a full footprint stack configured on a prop account. For the broader indicator context that pairs with order flow, see the best indicators for futures trading and the best indicators for day trading.
Why futures, not stocks
Order flow works where volume is real and sits in one place. US equity index and commodity futures trade on a single central exchange, so the DOM and tape reflect the whole market. Stocks fragment across many venues and dark pools, so one feed shows only a slice of the flow. Crypto perpetuals on a major exchange have usable order flow, but every exchange is its own book. For prop traders the cleanest order flow is on centralized futures like ES, NQ and GC, which is exactly the market most US futures prop firms run on.
Order flow trading at a prop firm
Order flow trading is fully compatible with most US futures prop firms, because their simulated accounts route on real exchange data and many ship platforms with DOM and footprint support. The account is simulated; the order flow data underneath it is the live exchange feed, which is what makes the read valid.
Firms like Lucid Trading, Alpha Futures and FundedSeat run on futures data where order flow is cleanest, and larger firms such as Topstep and Apex Trader Funding support DOM-capable platforms like Tradovate and NinjaTrader. Two practical checks before you commit a strategy to an evaluation:
- Confirm depth and tape access on the platform the firm gives you. If you only get Level 1, you cannot trade order flow there.
- Check the rules on scalping and hold time. Order flow setups are often short-duration, and a few firms restrict very short holds or news scalping.
If you want to test a footprint workflow cheaply, an evaluation on a firm like Lucid (code VIBES) gives you a real futures feed to read the tape against without your own capital at risk. Read the live firm page for current platform support before you buy, since platform line-ups change.
The bottom line
An order flow trading strategy reads the real orders, the DOM, the tape, the footprint and CVD, instead of waiting for a candle to close, and it builds entries from four repeating signatures: absorption, exhaustion, stacked imbalances and liquidity sweeps. It is the right tool for intermediate futures traders who already understand structure and want a precise execution edge, especially on centralized markets like ES, NQ and GC where the volume is genuinely real.
It is the wrong tool if you are new, if you do not yet trade with defined risk, or if you want a complete mechanical system you can run without screen time. In that case learn volume profile and VWAP first, get your structure solid, then add the footprint and DOM once reading the tape is the trigger and not the whole plan. For prop traders, order flow pairs cleanly with most US futures accounts, just confirm your platform exposes depth and time and sales before you trade it.
Frequently Asked Questions
What is an order flow trading strategy?
An order flow trading strategy is a method that bases entries and exits on the actual buy and sell orders hitting the market, rather than on lagging indicators derived from closed prices. You read the depth of market (DOM), footprint or cluster charts, time and sales (the tape) and cumulative volume delta (CVD) to see who is aggressive, where liquidity sits, and when one side absorbs or exhausts the other. The four classic setups are absorption, exhaustion, imbalance and liquidity sweeps.
How do you read order flow for trading?
You read order flow across four data views. The DOM shows resting limit orders (liquidity that has not traded yet). Time and sales, the tape, shows every execution as it prints, with size and aggressor side. Footprint charts split each candle into buy volume versus sell volume at each price. Cumulative volume delta sums net aggressive buying minus selling over time. You combine them: liquidity on the DOM tells you where, the tape tells you how fast, the footprint tells you who won at each level, and CVD tells you the running balance.
What is the difference between order flow and price action?
Price action reads the shape of closed candles, support and resistance, and patterns, all of which are downstream of the orders that already executed. Order flow reads the orders themselves as they hit, before the candle closes. Price action tells you what happened; order flow trading tries to tell you what is happening right now and who is forcing it. Most order flow traders still use price action for structure and context, then use the tape and footprint for timing.
What is absorption in order flow?
Absorption is when aggressive market orders hit a price level repeatedly but price does not move, because a large resting limit order is soaking up all of that aggression. On a footprint chart you see heavy sell volume at a price with no downward follow-through; on the DOM you see a big bid refilling. Absorption often precedes a reversal, because the aggressive side spent its ammunition and the passive side held the level.
What is an imbalance in order flow trading?
An imbalance is when buy volume heavily outweighs sell volume (or vice versa) at a given price on a footprint chart, typically using a ratio like 3:1 or 4:1 diagonally between bid and ask volume. A single imbalance is noise. Stacked imbalances, several in a row in the same direction, signal one-sided aggression and are used as a continuation or breakout confirmation. Many footprint platforms highlight imbalances automatically.
What is a liquidity sweep?
A liquidity sweep is when price pushes through an obvious level where stop orders are resting, for example just below a swing low, triggers those stops, then reverses sharply. The move is engineered to fill large orders against the trapped traders' stops. In order flow you spot a sweep by watching the tape accelerate into the level, the DOM liquidity vanish, then aggressive flow flip to the other side immediately after.
What is cumulative volume delta (CVD)?
Cumulative volume delta (CVD) is a running total of aggressive buy volume minus aggressive sell volume, where buys are market orders lifting the offer and sells are market orders hitting the bid. Rising CVD means net buying aggression; falling CVD means net selling. The most-watched signal is divergence: price makes a new high but CVD does not, meaning the new high was reached without fresh aggressive buying, which often precedes a fade.
What platforms are used for order flow trading?
Bookmap is the best-known dedicated order flow tool, built around a heatmap that visualizes resting liquidity and a CVD or speed-of-tape panel. Footprint and cluster charting is available in Sierra Chart, ATAS, Volumetrica, Quantower and several Tradovate-connected add-ons. The data feed matters more than the front end: order flow needs full depth and tick-by-tick time and sales, which futures exchanges provide and which is why most order flow trading happens on futures.
Does order flow trading work on stocks and crypto?
Order flow works best where volume is real and consolidated. US equity futures and commodity futures trade on a single central exchange, so the DOM and tape reflect the whole market. Stocks fragment across many venues and dark pools, so a single feed shows only part of the flow. Crypto perpetuals on a major exchange have usable order flow, but each exchange is its own book. For most prop traders the cleanest order flow is on centralized futures like ES, NQ and GC.
Is order flow trading good for beginners?
Order flow trading is not a beginner starting point. It assumes you already understand market structure, risk and position sizing, and it adds a fast, dense data stream that is easy to over-read. Beginners are better served learning volume profile and VWAP first for context, then layering the DOM and footprint once the basics are automatic. Order flow rewards screen time, so it suits intermediate traders building a precise execution edge.
Can you use an order flow strategy at a prop firm?
Yes. Order flow trading is fully compatible with most US futures prop firms, because their simulated accounts route on real exchange data and many provide platforms with DOM and footprint support, such as Tradovate, NinjaTrader and Quantower. Firms like Lucid Trading, Alpha Futures and FundedSeat run on futures data where order flow is cleanest. Check that your platform exposes time and sales and depth, and confirm the firm allows scalping, since order flow strategies are often short hold-time.
How is order flow different from volume profile?
Volume profile is a longer-timeframe map of where volume traded across price, building areas of acceptance like the point of control and value area. Order flow is the moment-to-moment view of who is aggressive right now. They pair well: volume profile and VWAP give you the levels and context, and order flow gives you the trigger at those levels. Many traders set up at a high-volume node from the profile, then use the footprint and tape to time the entry.
What is exhaustion in order flow?
Exhaustion is when an aggressive trend runs into a level and the aggression visibly dries up, shrinking footprint volume on the trending side and a stalling CVD, even though price reached the extreme. It is the opposite signature of a strong move: the last push had no fuel behind it. Exhaustion is often paired with absorption, the trend exhausts while a large passive order absorbs the final orders, setting up a reversal.
Do you need Level 2 data for order flow trading?
Yes. Order flow trading requires Level 2 market depth (the DOM showing resting bids and offers beyond the best price) and tick-by-tick time and sales. Level 1, the top-of-book bid, ask and last, is not enough to read absorption or liquidity sweeps. Futures exchanges sell this depth data, and most futures prop platforms include it. Without depth and the tape, you are reading price action, not order flow.