
Table of contents
Quick Answer — What is market profile trading?
- • Market profile is a chart that organizes a session by time-at-price using TPO (Time Price Opportunity) letters, developed by Peter Steidlmayer at the Chicago Board of Trade in the 1980s.
- • The value area is the price range where roughly 70% of the session's TPOs occurred, the one-standard-deviation band around the fairest price.
- • The point of control (POC) is the single price with the most TPOs, the session's clearest acceptance level.
- • Day types (normal, normal variation, trend, neutral) describe how the distribution formed and hint at who controlled the session.
- • Market profile reads time-at-price; volume profile reads volume-at-price. Most traders run both because they answer different questions.
Market profile is a charting method that organizes a trading session by how much time the market spent at each price, using TPO (Time Price Opportunity) letters to build a distribution. Peter Steidlmayer developed it in the 1980s while trading at the Chicago Board of Trade, and it spread through the CME as a way to see an auction's structure instead of just a line of candles. Where a candlestick chart plots price against time on the x-axis, a market profile collapses the session sideways into a bell-shaped picture of where price was accepted and where it was rejected.
The whole method rests on one idea: a market is a two-way auction searching for a fair price. When buyers and sellers agree, price lingers and the distribution fattens. When one side dominates, price runs and leaves a thin tail. Market profile makes that visible at a glance.
This guide walks through TPO, the value area, the point of control, the initial balance, day types, and single prints, then shows how market profile sits next to volume profile and order flow in a real trading workflow.
What is a TPO and how does the profile get built?
A TPO, or Time Price Opportunity, is a single letter printed at a price level for each time bracket the market traded there. The standard bracket is 30 minutes, and each bracket gets its own letter: A for the first half hour, B for the second, and so on through the session.
Here is the mechanic. During bracket A, price might range from 5,000 to 5,010. Every price level touched in that window gets an "A". During bracket B, price trades 5,005 to 5,015, so those levels get a "B". Stack the brackets left to right and then push every letter to the left margin, and you get a horizontal histogram. The widest part, where the most letters pile up, is where the market spent the most time.
That shape is the profile. A balanced session forms a fat bell. A trending session forms a long, thin "P" or "b" shape. The structure tells you who was in control before you read a single indicator.
Why time-at-price matters
Time at a price is a proxy for acceptance. If the market revisits 5,005 across six different brackets, both sides keep agreeing that 5,005 is fair. If price blows through 5,020 in a single bracket and never comes back, that level was rejected. Steidlmayer's insight was that organizing price this way exposes the auction's intent, which a time-series candle chart hides.
For a deeper look at the volume-based cousin of this idea, our guide to volume profile covers the same distribution logic measured by contracts traded instead of time.
What is the value area in market profile?
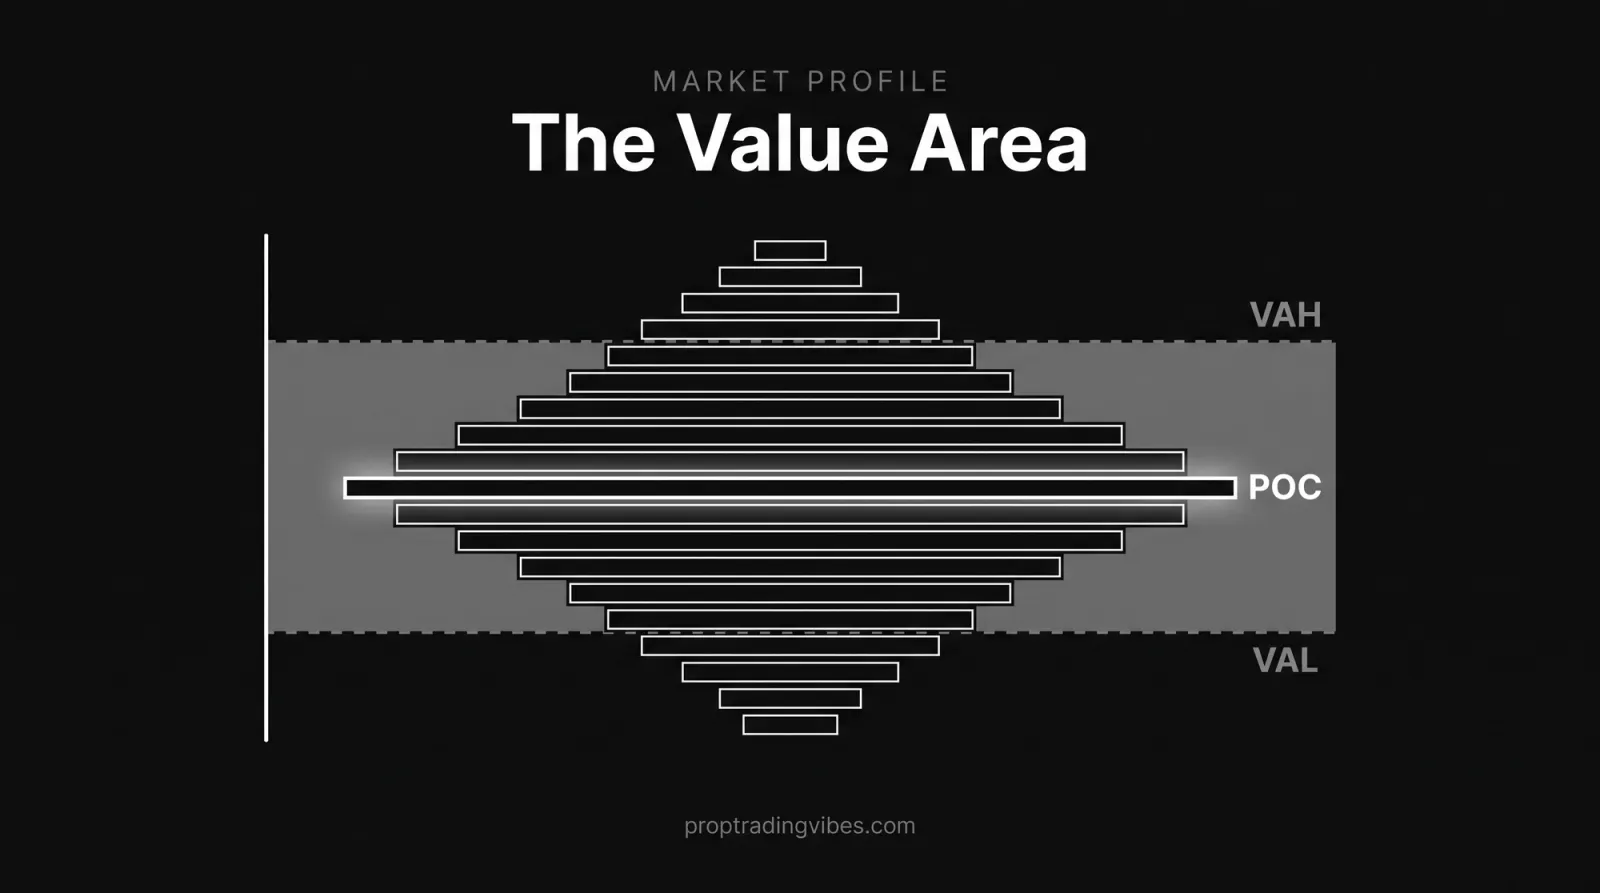
The value area is the price range that holds roughly 70% of a session's TPOs, the band the market treated as fair. It sits around the mean of the distribution and is defined by two edges: the value area high (VAH) at the top and the value area low (VAL) at the bottom. Together they fence off the prices where the auction did most of its business.
To build it, the platform starts at the point of control and adds TPO counts outward, one level up or one level down, always taking the heavier side, until it has captured about 70% of the total TPOs. Whatever range that leaves is the value area.
Why is the value area 70%?
The 70% figure approximates one standard deviation of a normal distribution, which mathematically captures about 68.2% of the data. Steidlmayer treated an auction's accepted prices as roughly bell-shaped, so the central one-standard-deviation slice became the working definition of "value". It is a statistical convention, not a market law, but it is consistent and it is what nearly every platform uses by default.
Trading around the value area
The value area gives you reference points, not signals. The best-known convention is the value area rule: when price opens outside the prior-day value area and then trades back inside it, there is a tendency to rotate toward the opposite edge. Balanced markets often see value get faded from the edges; trending markets see value get accepted higher or lower as the session extends. None of this is automatic, and it pairs far better with confirmation from order flow trading than it does standing alone.
What is the point of control (POC)?
The point of control is the single price level with the most TPOs in a session, the price where the market spent more time than anywhere else. It is the peak of the bell, the fairest price both buyers and sellers kept returning to. On the chart it is usually the longest row of letters.
The POC matters most after the session closes. A prior-day POC becomes a reference level the next session, often acting as a magnet that price drifts toward or a shelf that price reacts off. Tracking a series of recent POCs shows you where the market has repeatedly found agreement, which is more durable than a single swing high or low.
Naked POCs and untested levels
A "naked" POC is a prior point of control that price has not revisited since it formed. These tend to draw price back because the level once held strong agreement and the auction often returns to test it. Many market profile traders keep naked POCs on the chart until they get tested, then drop them. It is the same instinct that makes market structure trading watch unfilled imbalances and untested swing points.
What is the initial balance?
The initial balance is the price range established in the first hour of trading, the first two 30-minute TPO brackets (A and B). It frames the session's early conviction and becomes the yardstick for everything that follows.
The key question every session asks is whether price stays inside the initial balance or breaks out of it. When the market holds inside the initial balance, the session is more likely to rotate and balance, and value tends to build in the middle. When price extends well above or below it, that signals other-timeframe participants, longer-horizon buyers or sellers, stepped in, and the odds of a directional day rise.
Initial balance width is itself a tell. A wide initial balance means early aggression and often a contained day, because the range is already large. A narrow initial balance leaves room to run and frequently precedes a trend day with a big extension.
What are the market profile day types?
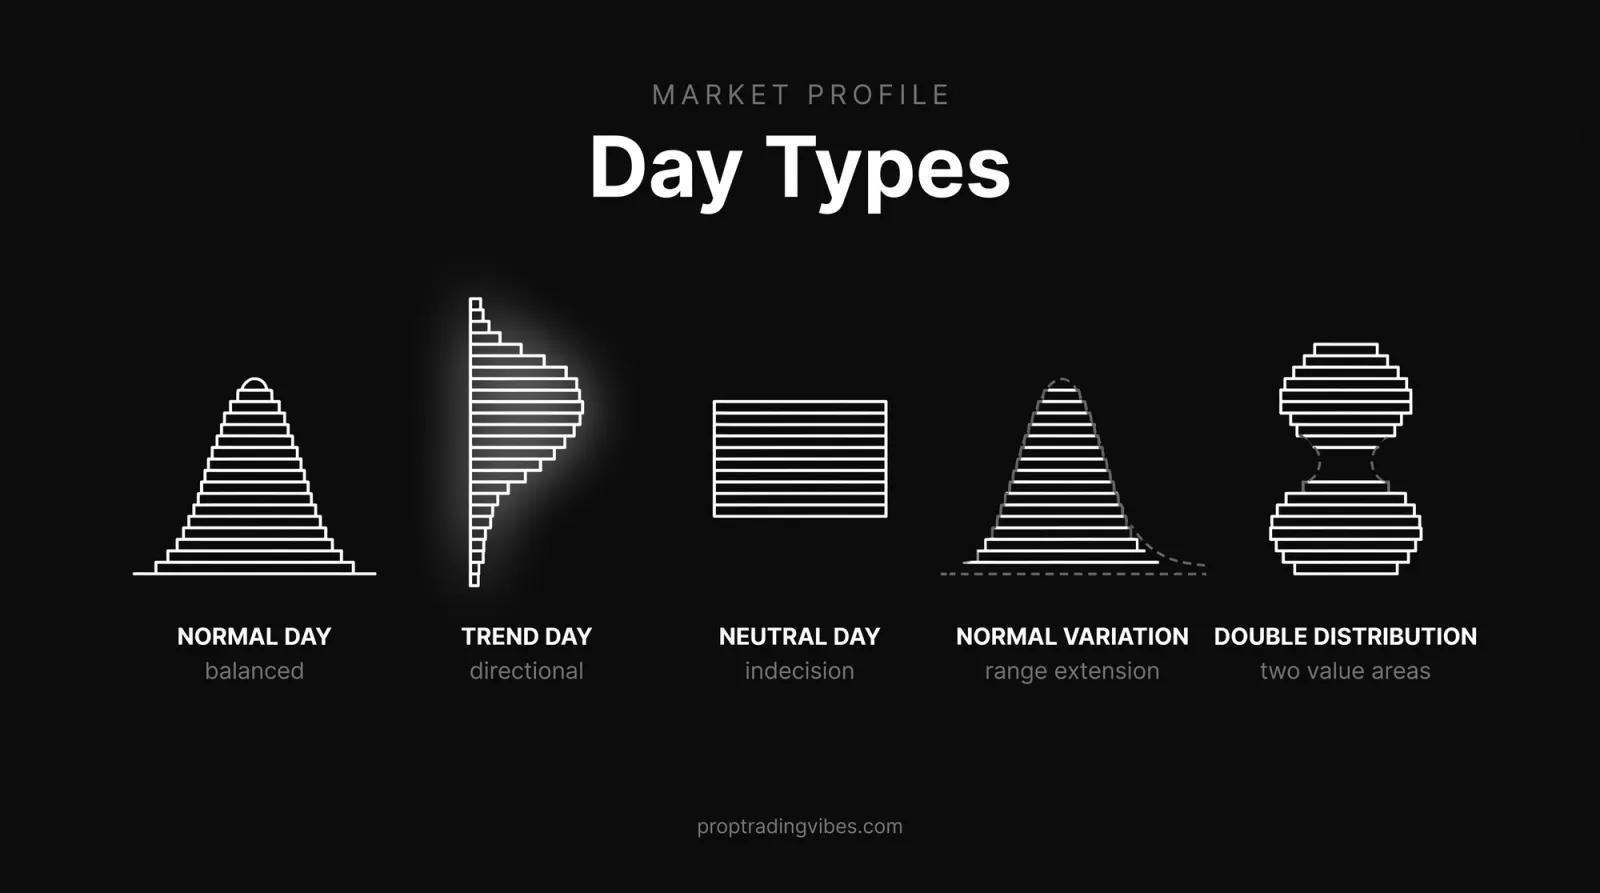
Day types describe how the session's distribution formed, which hints at who controlled the auction. As of 2026, the framework Steidlmayer popularized still uses the same core categories:
| Day type | What the profile looks like | What it implies |
|---|---|---|
| Normal day | Fat, single bell near the initial balance | Balanced, two-way auction; range-bound |
| Normal variation day | Bell with one moderate extension past the initial balance | Mild directional bias, still mostly balanced |
| Trend day | Long, thin "P" or "b" shape extending far one way | One side dominates; strong directional move |
| Neutral day | Price probes above and below the initial balance | Indecision; both sides tested, often closes mid-range |
| Double-distribution day | Two separate bells joined by a thin middle | A move to a new area of acceptance; gap in time |
Reading the day type early helps you size and place trades correctly. Fading the edges works on a normal day and gets you run over on a trend day, so identifying which kind of session is forming is half the battle. The initial balance and the first extension usually give it away before noon.
What are single prints?
Single prints are price levels printed by only one TPO letter, the thin tails where price moved through fast and never came back to build acceptance. They mark rejection and excess, the spots where the auction decided fair value was elsewhere and left in a hurry.
These levels matter because the market tends to revisit them. A single print is unfinished business: price moved too quickly to establish whether anyone agreed at those levels, so the auction often returns to test them later. Traders mark single-print zones as targets and as reaction areas, the same way they treat the gaps left by a fast move on a volume chart.
Buying and selling tails
A buying tail is a stack of single prints at the bottom of the profile, where price probed lower, found aggressive buyers, and snapped back up. A selling tail is the mirror at the top. Long tails signal strong rejection at that extreme and often hold as reference levels into the next session. Short or absent tails suggest the move had less conviction.
How does market profile differ from volume profile?
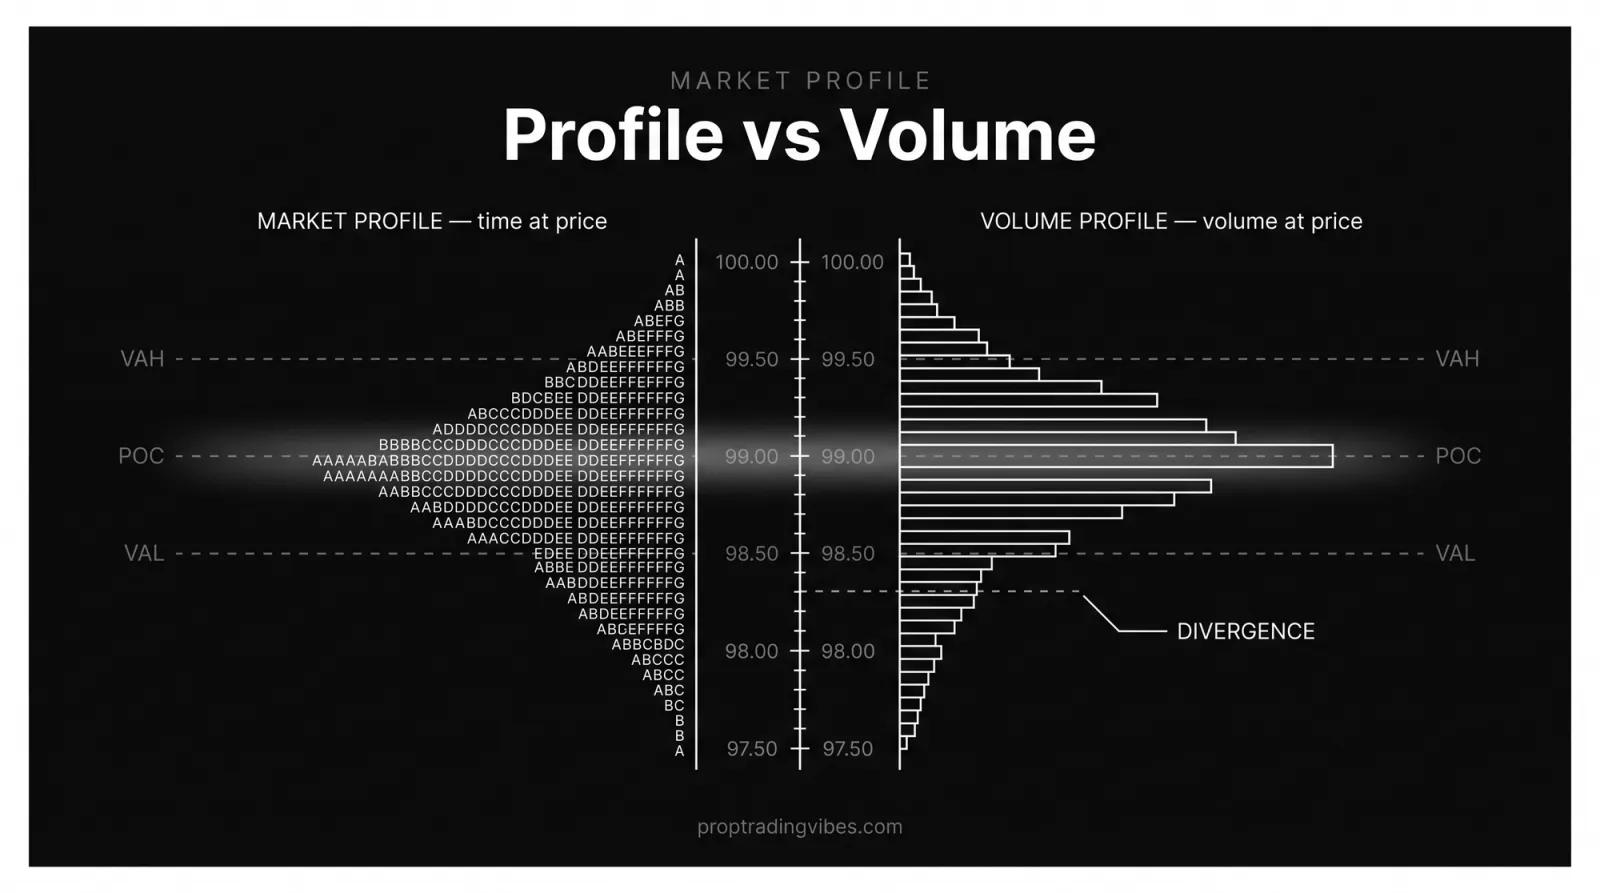
Market profile measures time at a price using TPO letters; volume profile measures volume traded at a price. Both build a horizontal distribution and both produce a point of control and a value area, but they answer different questions. Time-at-price asks where the market lingered. Volume-at-price asks where the most contracts changed hands.
| Market profile | Volume profile | |
|---|---|---|
| Unit | TPO letters (time) | Volume (contracts) |
| Point of control | Most time at a price | Most volume at a price |
| Value area | ~70% of TPOs | ~70% of volume |
| Best for | Auction structure, day types, context | Where size traded, absorption, big players |
| Origin | Steidlmayer / CBOT, 1980s | Later volume-based extension of the same idea |
In practice they usually agree, because where the market spends time it also trades volume. The interesting moments are when they diverge: a price level with lots of time but little volume can mean a quiet drift, while heavy volume in a short time window can mark a violent rejection. That gap between time and volume is itself information. Most futures traders run both, and our volume profile guide and order book guide cover the volume side in depth.
Where order flow and VWAP fit
Market profile and volume profile give you the macro structure of a session. Order flow gives you the micro: which side is hitting the bid or lifting the offer right now. The two layers complement each other, with structure telling you where to look and order flow telling you when to act. Many traders also overlay VWAP as a session-anchored fair-value line that often lines up closely with the POC. For the screen-time tooling side, a Bookmap-style heatmap shows resting liquidity that the profile cannot.
How I use market profile in my own trading
I came to market profile late. For a long stretch I traded pure price action on candlesticks and kept getting chopped at the same prices without understanding why. Printing a TPO chart on the instrument I trade every day changed the way I read context. I stopped asking "is this support" and started asking "did the market accept this price or reject it".
The three references I lean on most are the prior-day POC, the value area edges, and the initial balance. If the session opens inside the prior value area, I expect rotation and I trade the edges. If it opens outside and extends past the initial balance, I respect the trend and stop fading. That single distinction has saved me from more bad trades than any indicator I have ever loaded.
The other habit that stuck: running market profile and volume profile together. When time-at-price and volume-at-price agree on a level, I size up and trust it. When they disagree, I slow down and wait for order flow to break the tie. None of this is magic. It is context, and context is the part most funded traders skip while they hunt for the perfect entry.
On the platform side, this all runs fine inside a funded account. Market profile is an analysis method, not a strategy any firm bans, so it lives comfortably inside normal risk limits. Firms like Lucid Trading, Topstep, and Take Profit Trader run platforms that render TPO and volume profile out of the box, and a multi-asset firm like E8 Markets gives you the same charting across instruments. Whatever you trade, knowing the session's futures market hours matters here, because the profile is anchored to the session open and a mis-set session start scrambles the whole distribution. If you want a worked example on a specific platform, our Volumetrica setup walkthrough gets you a clean TPO chart fast.
The bottom line
Market profile is the right tool for traders who want to read a session's structure instead of guessing at support and resistance. It excels at showing acceptance versus rejection through the value area, the point of control, the initial balance, and day types, and it pairs naturally with volume profile and order flow for a complete read. If you trade futures and you have never run a TPO chart, the prior-day POC and value area alone will sharpen your context immediately.
It is not a standalone entry system, and traders who want mechanical signals will find it frustrating because it gives reference points, not triggers. If that is you, lean on order flow trading or a VWAP strategy for the timing layer and let market profile handle the map. Structure first, timing second. That is the order that has worked for me.
Frequently Asked Questions
What is market profile trading?
Market profile trading is reading a chart that organizes price by how much time the market spent there, using TPO (Time Price Opportunity) letters. Peter Steidlmayer built it at the Chicago Board of Trade in the 1980s to show where price was accepted versus rejected. Traders use the value area, point of control, and shape of the distribution to judge whether a market is balanced or trending.
What does TPO mean in market profile?
TPO stands for Time Price Opportunity. Each TPO is one letter printed at a price level for every time bracket (usually 30 minutes) that the market traded there. Stack the brackets and you get a bell-shaped distribution that shows where the session spent the most time. TPO is the core unit of a market profile chart.
What is the value area in market profile?
The value area is the price range that contains roughly 70% of a session's TPOs, which corresponds to about one standard deviation around the mean of a normal distribution. It marks the prices the market accepted as fair. The upper edge is the value area high (VAH) and the lower edge is the value area low (VAL); traders watch both as reaction levels.
Why is the value area 70%?
The 70% figure approximates one standard deviation of a normal (Gaussian) distribution, which captures about 68.2% of the data. Steidlmayer's framing treats an auction's accepted prices as roughly bell-shaped, so the central 70% of TPOs becomes the value area. It is a convention rooted in statistics, not an exact law of markets.
What is the point of control (POC)?
The point of control is the single price level with the most TPOs in a session, meaning the market spent more time there than anywhere else. It represents the fairest price, the level both buyers and sellers agreed on most. The POC often acts as a magnet or a reaction point in later sessions, which is why traders track prior-day POCs.
What is the initial balance in market profile?
The initial balance is the price range set during the first hour of trading, the first two 30-minute TPO brackets. It frames early conviction. When later price extends well beyond the initial balance, it signals other timeframe participants entered; when price stays inside it, the session is more likely to balance and rotate.
What are the market profile day types?
The main day types are the normal day, normal variation day, trend day, neutral day, and double-distribution day. They describe how the session's distribution formed: a trend day extends far past the initial balance in one direction, a normal day stays close to a single balanced bell, and a neutral day probes both sides of the initial balance before settling.
What are single prints in market profile?
Single prints are price levels touched by only one TPO letter, usually where price moved fast and left a thin tail. They mark areas of rejection or excess. Single prints often get revisited later because the auction moved through them too quickly to establish acceptance, so they act as reference levels for future moves.
What is the difference between market profile and volume profile?
Market profile measures time at a price using TPO letters; volume profile measures volume traded at a price. Time-at-price tells you where the market lingered, volume-at-price tells you where the most contracts changed hands. They usually agree, but when they diverge, the gap itself is a signal. Many futures traders run both side by side.
Is market profile useful for day trading futures?
Yes, market profile is widely used by futures day traders because the futures session has a clear open, close, and continuous auction that suits TPO charting. Traders use the prior-day value area and POC as reference levels, and the initial balance to gauge whether the current session is trending or rotating. It pairs well with order flow tools for entries.
Who created market profile?
Peter Steidlmayer created market profile in the 1980s while trading at the Chicago Board of Trade, with the concept publicized through the CME (Chicago Mercantile Exchange). His goal was to organize raw price action into a statistical distribution so traders could see acceptance and rejection rather than just candles on a time axis.
Do I need special software for market profile?
You need a platform that renders TPO charts, which most serious futures platforms support, including Sierra Chart, NinjaTrader, ATAS, Volumetrica, and Quantower. Many prop firms offer these platforms with their funded accounts, so you can run market profile and volume profile on the same data you trade live. A standard candlestick-only chart cannot build a TPO distribution.
Can I use market profile on a funded prop account?
Yes, you can use market profile on a funded prop account as long as the firm's platform supports TPO charting, which most futures-focused platforms do. Market profile is an analysis method, not a trading strategy banned by any rule, so it sits inside normal risk limits. Firms like Lucid Trading and Topstep run platforms that render TPO and volume profile out of the box.
How do you trade with the value area?
A common approach is the value area rule: if price opens outside the prior-day value area and then re-enters it, there is a tendency to rotate toward the opposite edge. Traders also fade moves back into value when a market is balanced, and trade breakouts from value when the initial balance extends. The value area gives you reference points, not automatic entries.